I have run the test project in couple more scenarios to ensure we did not miss anything. I measured 10.000 HTTPS requests. In all cases, the memory is stable.
I measured 3 values:
1. Allocated memory reported by Garbage Collector (informative).
2. Available virtual memory.
3. Available physical memory on device (informative).
I measured 4 scenarios:
1. System HTTPS - for reference.
2. TLS session cache enabled, HTTP session cache disabled - new connection is established for each request, but TLS sessions are resumed, causing minimal TLS overhead and certificate validation (measures the most typical scenario).
3. TLS session cache disabled, HTTP session cache disabled - new connection with complete TLS negotiation and certificate validation is established for each request (measures leaks in whole process).
4. TLS session cache enabled, HTTP session cache enabled - connections are reused for subsequent requests (measures leaks in HTTP communication).
The measured data with charts is available to download here.
The charts:
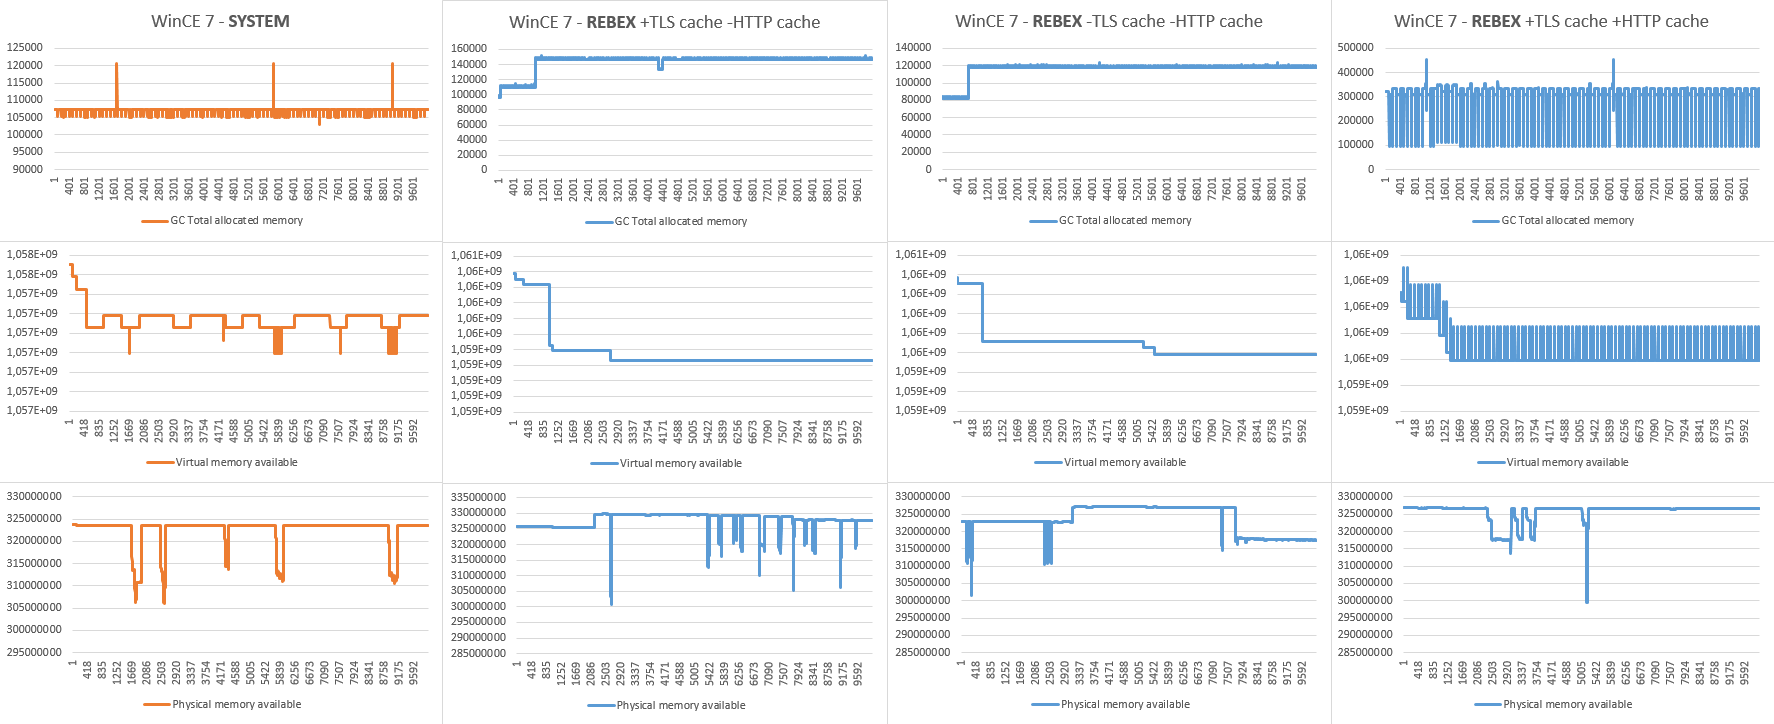
Notes to charts:
- The system HTTPS uses TLS 1.0 and it probably uses all kinds of caching (TLS, HTTP, certificate validation). It is included not for comparing efficiency, but to compare memory profile.
- The 4th chart (all caching enabled) reflects situation, where every 100th request is forced to establish new connection with full TLS negotiation (server closed the connection after reusing it for 100 HTTPS requests).
- The measured physical memory is informative, since it is affected by other processes on the device (not only by the test application).
Conclusion:
- We were not able to identify any further memory leaks in the current version.
- The 64KB memory leaks spotted in early stage of measures are present in system HTTPS measures as well. The charts shows that they occur "frequently" at the beginning of the measures, but very rarely lately in the process.
- I will run the test app for more than 24h to see how often the 64KB leaks occur. Since you reported average leak of 1MB/day it can be caused by 16 leaks of 64KB.
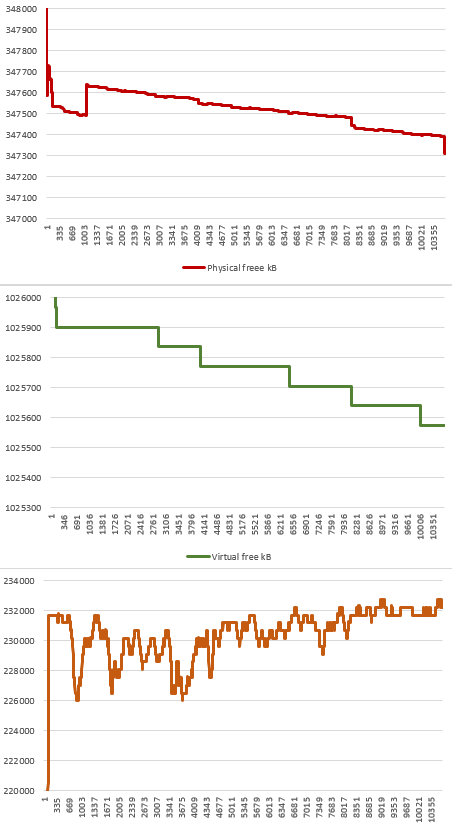
Extra:
Just for reference, I am including memory profile from our measures before version 2019R3.7, which identified (currently fixed) memory leak: